

Think a string of spectacular saves proves you’ve found a great goalie?
It’s a trap.
Film shows the build-up and technique, and stats give you objective patterns the eye misses.
Use both every time: let numbers flag issues, then pull video to find the why.
That’s how you move from guessing to coaching, and from highlights to real development plans that fix positioning, distribution, and cross control.
Read on for a step-by-step method that scouts and coaches can actually use.
Core Methodology for Evaluating a Goalkeeper with Video and Stats
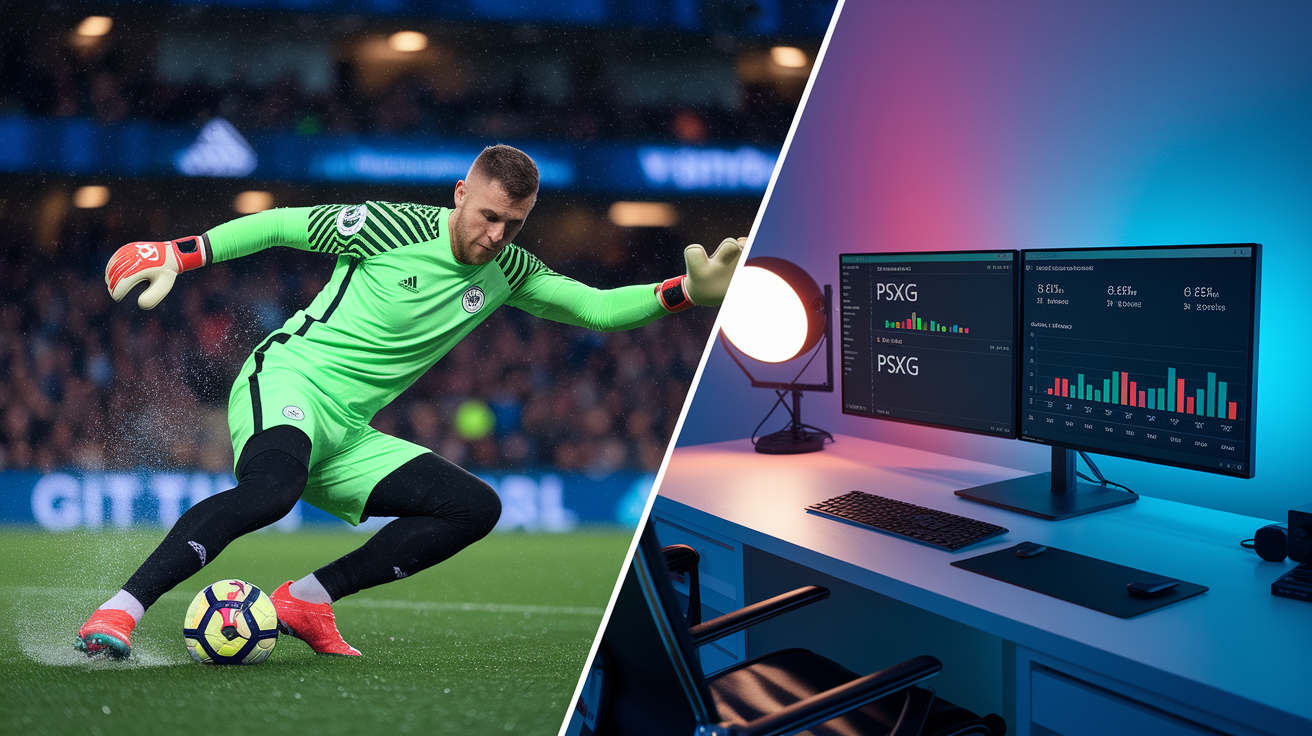
You need two things to evaluate a goalkeeper properly: video and stats. They don’t overlap. They fill in each other’s gaps.
Video shows you what happened before the ball got there. Positioning mistakes two steps early. Footwork breaking down during transitions. Communication with defenders (or the lack of it). Stats give you the objective part, the stuff that doesn’t care how you felt watching the game. A goalkeeper making diving saves all over the place might actually be out of position constantly. Another one who looks boring? Could be reading plays perfectly and never needing the heroics.
The best way to do this is to use both at every stage. Video confirms what the numbers are telling you. And it shows you why the numbers look the way they do. Say a keeper’s save percentage on low crosses is terrible. Pull the video and you’ll probably see late movement. If distribution stats look good, the footwork and decision speed should back that up on film. Stats alone miss everything that matters around the shot: team shape, how dangerous the chance actually was, whether the defense left the keeper exposed. Video alone? You’re guessing. And you’ll probably just see what you want to see.
Here’s how a full evaluation actually works:
-
Pull the stats first across the metrics that matter: save percentage by zone, post-shot expected goals, cross success, distribution accuracy, whatever period you’re evaluating.
-
Pick real game samples that show different situations. High pressure moments. Blowouts. Direct attacks. Long defensive stretches. Don’t just watch their best game.
-
Watch the video for the moments the stats flagged, looking at positioning, technique, timing, and outcomes on shots, crosses, breakaways, and passes.
-
Match what you see to what the stats say, figuring out whether the numbers are weird because of technique problems, defensive structure, or just shot quality variance.
-
Build the profile that ties it all together: strengths, weaknesses, what needs work, and what’s just context. Something you can actually use for coaching or recruiting.
Key Statistical Metrics for Assessing Goalkeeper Performance

Post-shot expected goals minus goals conceded (PSxG-G) tells you how good the shot stopping actually is. It compares the quality of shots faced to goals allowed. If a keeper finishes the season at +5.0, they prevented five goals compared to what an average keeper would’ve done on the same shots. This cuts out the team defense part way better than raw save percentage, which treats a speculative 35-yard shot the same as a tap-in from six yards.
Pro keepers in top leagues usually land somewhere between -2.0 and +8.0 over a full season. Above +10.0? That’s elite. Consistently negative even when save percentage looks fine? Below average shot stopping.
Save percentage split by location shows you where they’re actually good and where they’re not. Break it into zones: central box, wide areas, edge of box, outside the box. You’ll see patterns. A keeper at 78% in the central box but 88% at the edge might be solid on longer shots but vulnerable up close. That’s a positioning or reaction thing, not randomness.
Cross-claim success rate measures how often they come off their line and actually get the ball versus punching it, missing it, or leaving it for defenders. Elite keepers claim somewhere between 12% and 18% of crosses into their area. Below 8%? Usually hesitancy or poor communication. Above 20%? Probably too aggressive, which means mistakes when they mistime it.
Handling errors and distribution accuracy under pressure tell you about composure and whether they can play with their feet. Track fumbles, dangerous parries, second-chance rebounds. Then look at passing: completion percentage when pressed, short passing accuracy (usually 85% to 95% for top keepers), long ball success (55% to 70%). A keeper hitting 92% short but only 48% long might panic under pressure or just lack the technique for distance.
Sweeping actions (interventions outside the penalty area) show how proactive they are. High line systems need keepers averaging 1.5 to 3.0 sweeps per 90. Under 1.0 means they’re not reading space well or they’re reluctant. Over 4.0? Probably too far off their line or misjudging when to actually go.
The stats that matter:
- Post-shot expected goals minus goals conceded (PSxG-G) for shot stopping quality without team defense muddying it
- Save percentage by zone to find positional strengths and technical holes
- Cross-claim success rate for aerial ability and decision making
- Handling errors and rebound control for technical consistency
- Passing completion under pressure for composure and distribution skill
- Sweeping actions per 90 for defensive awareness and positioning choices
Video Analysis Techniques for Goalkeepers

Don’t just watch full matches. Isolate the moments. Every shot faced. Every cross into the box. Every one-on-one. That’s how you build the real picture.
Start two seconds before each event. Where are their feet? Shoulders square to the ball? Weight forward or back? Hands ready or hanging low? A keeper caught on their heels before a low shot isn’t going to save it no matter how athletic they are.
Set position matters more than anything for routine saves. Good set position: knees bent, weight on the balls of the feet, hands around mid-thigh, shoulders square. Standing too tall kills lateral quickness. Hands too low adds reaction time you don’t have. Movement quality is what separates levels. Watch the footwork during angle adjustments. Short controlled steps or long unbalanced ones? Crossing feet during side movement? Diving early before the shot? All bad habits that show up as goals.
Decision making shows up clearest on crosses and through balls. Do they commit early and go, or hesitate and arrive late? An aggressive keeper who mistimes three crosses might just need better communication with the backline. A passive one who never goes for anything? Confidence problem or spatial awareness problem. Distribution technique (throwing and kicking) shows composure. Poor contact on goal kicks, floaty throws, panicking under pressure… all technical gaps that hurt the team.
Break down film using five angles so you don’t miss anything:
- Shot stopping for positioning, footwork, reaction timing, save technique, body shape on contact
- Crosses and high balls for starting position, path to the ball, timing, handling, communication
- One-on-ones for angle narrowing, patience, positioning relative to near post, dive or block technique
- Buildup involvement for receiving position, first touch, decision speed, passing accuracy, handling pressure
- Communication and organization for vocal direction, adjustments before set pieces, line management
Correlating Video Insights with Statistical Patterns

When the stats look weird, that’s your cue to go to the video. If a keeper’s at PSxG-G of -4.0 over ten matches, watch the goals. You’re looking for positioning depth, angle coverage, reaction mechanics. Persistent underperformance in expected goals always shows one of three things on film: starting position wrong (too deep or too shallow), poor footwork during adjustments, or slow reactions because their weight’s in the wrong place. A keeper with good overall save percentage but bad numbers on low shots? Probably standing too upright or hands too high.
Cross-claim rate connects straight to what you see. Keepers above 15% make early decisions, move explosively, catch with two hands at the highest point. Below 8%? They’re starting deeper, hesitating during flight, punching instead of claiming. Distribution stats show composure. Low passing completion under pressure usually means rushed decisions on film, bad foot positioning on kicks, not scanning before receiving back passes.
Map every major stat to what you actually see. Here’s how the numbers connect to real behaviors:
| Metric | Video Behavior Indicator | Typical Interpretation |
|---|---|---|
| Negative PSxG-G (below -3.0) | Deep starting position, late set, upright posture before shots | Positioning habits or reaction mechanics reducing save chances |
| Low cross-claim % (under 8%) | Hesitant movement, late jump timing, punching instead of catching | Confidence issues or communication problems leading to passive play |
| High handling errors (2+ per match) | Soft hands, wrong hand shape, poor body positioning behind ball | Technical inconsistency or fatigue affecting basics |
| Low distribution accuracy (<80% short passes) | Rushed decisions, poor contact, no scanning before receiving | Composure under pressure or technical limits in passing |
| Excessive sweeping actions (>4.0 per 90) | Starting position way outside area, frequent sprints to edge, mistimed runs | Over-aggressive positioning or misjudging when to engage |
Tools and Platforms for Goalkeeper Evaluation

Modern goalkeeper analysis runs on platforms that mix video with stats, so you can compare performance data and actual footage side by side.
Wyscout has extensive match video with tagged goalkeeper actions. You can filter every save, cross, pass across multiple competitions. Shot maps show where saves happened and the expected goal value for each attempt. Makes it easy to spot positional patterns and success rates by zone. InStat does similar stuff with more goalkeeper-specific focus: claim rates, sweeping actions, passing breakdowns that update after every match.
StatsBomb and Opta give you the deeper stats beyond basic save percentage. Post-shot expected goals prevented, defensive actions outside the box, passing networks showing the keeper’s role in buildup. They include visualizations too: heat maps for starting position, pass direction charts, shot-facing angles. Makes complex data actually usable during video sessions.
Video tagging software like Nacsport and Hudl lets you build custom categories. “Cross claimed under pressure,” “one-on-one narrow angle,” “short pass breaking press,” whatever you need. Then you compile highlight reels filtered by success or failure.
Best setups use four tool types:
- Video platforms (Wyscout, InStat) for tagged match footage, search filters, shot maps, basic stats
- Analytics dashboards (StatsBomb, Opta) for detailed metrics like PSxG-G, save % by zone, distribution maps, sweeping tracking
- Custom tagging software (Nacsport, Hudl) for user-defined coding, highlight compilation, side-by-side comparisons
- Visualization tools (Tableau, Power BI, Excel) for charts, trends, performance summaries combining stats and video
Frequent Mistakes When Evaluating Goalkeepers
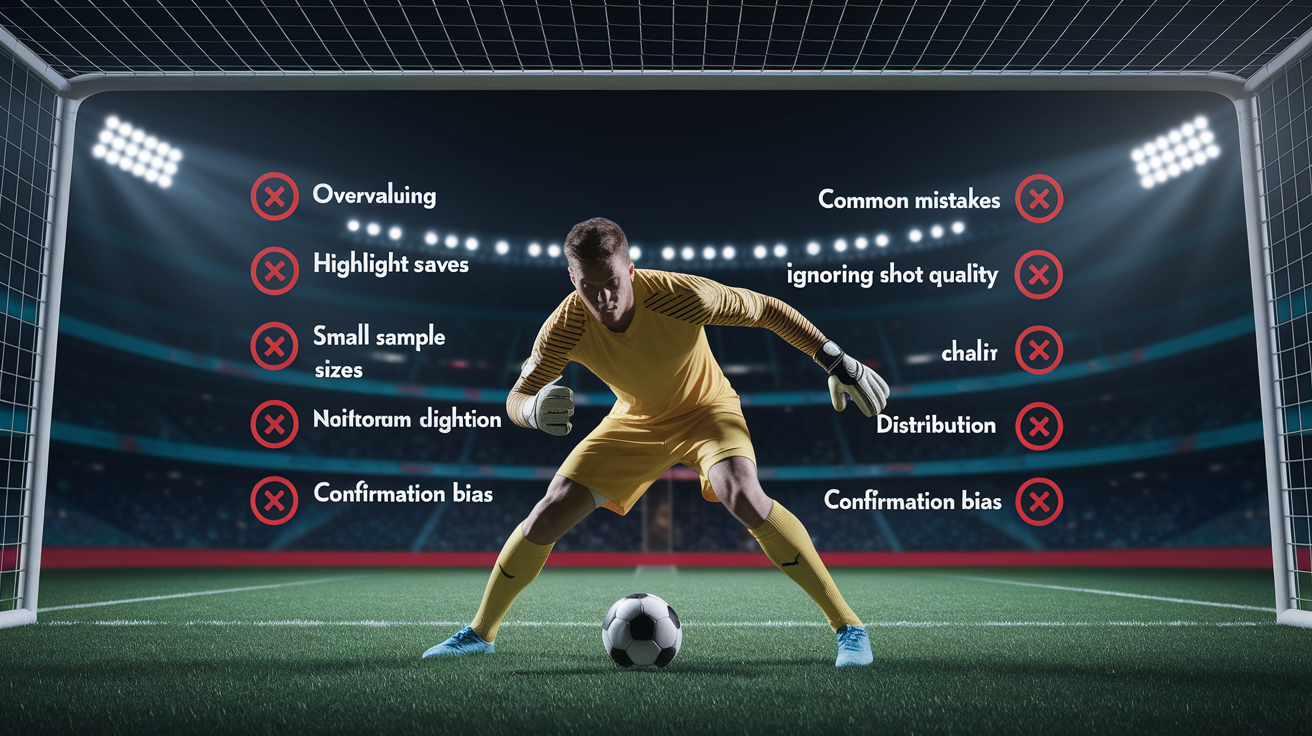
Biggest mistake? Overvaluing highlight saves while ignoring positioning errors. A keeper making three spectacular dives looks elite. But pull the video and all three might’ve come from bad starting position that made routine saves look difficult. Consistent shot stopping comes from correct angles and patience, not athleticism fixing mistakes. If you focus on acrobatic moments, you’ll miss keepers who rarely dive because they’re already in the right spot.
Misreading save percentage without shot quality context leads you wrong. A keeper facing lots of low-danger shots can hit .920 while performing below average for the difficulty. Another facing elite attackers and high-danger chances might save .880 yet actually prevent more goals than expected. Raw save percentage ignores team structure. A keeper behind a disciplined low block faces easier shots than one in a high press that gives up breakaways constantly. Compare save percentage to post-shot expected goals before deciding anything.
Don’t separate keeper performance from team tactics and you’ll distort everything. Distribution, sweeping, positioning depth all depend on system. A possession-based team means more passes under pressure and higher starting positions, which naturally increases both errors and sweeping actions compared to a direct, low-block setup. Cross-claim percentages change based on how aggressively defenders contest crosses wide. Teams that win balls early reduce volume reaching the keeper, inflating claim rates without the keeper being better in the air.
Five mistakes that wreck evaluations:
- Treating all saves the same, overweighting spectacular moments while undervaluing positioning that makes saves look easy
- Ignoring shot quality, judging save percentage without expected goals, team defense, or opponent strength
- Small sample sizes, drawing conclusions from two or three matches instead of 10+ games
- Forgetting distribution and sweeping, only watching shot stopping while ignoring buildup and coverage responsibilities
- Confirmation bias, letting early impressions color how you interpret everything that comes after
Final Words
In the action, we ran a step-by-step goalkeeper evaluation: gather data, pick sample matches, break down positioning and movement on film, then match those reads to stats like post-shot xG and save percentage.
We covered key metrics, film cues, how to pair video with numbers, tools that speed the work. Don’t overvalue highlight saves or ignore team structure.
Use this framework for how to evaluate a goalie using video and stats and you’ll make clearer, less biased calls. Keep testing it on matches. You’ll see smarter reads and better development plans.
FAQ
Q: How do you figure out and calculate goalie stats?
A: Figuring out and calculating goalie stats means tracking shots faced, saves, goals, minutes, and expected goals. Key formulas: save% = saves ÷ shots; GAA = (goals × 60) ÷ minutes; PSxG‑G = PSxG − goals.
Q: Where do you put your weakest player in hockey?
A: You put your weakest player on a sheltered role: fourth‑line winger, limited minutes, off key faceoffs, and away from net-front defensive matchups until they build confidence and positioning.
Q: What is the Martin Brodeur rule?
A: The Martin Brodeur rule is the NHL trapezoid restriction that limits where goalies can play the puck behind the net, introduced to curb Brodeur’s heavy puck‑handling and open the game for offense.