
Think power plays decide seasons? That’s backward.
Even strength, when both teams have the same number of skaters (usually 5-on-5), is where 75 to 85 percent of the game is played.
Teams that control possession and generate quality chances at even strength win more than those with flashy special teams.
This post will define even strength, show the key metrics coaches and analysts use (like Corsi and expected goals), and explain what players and systems actually do to tilt 5-on-5 in your favor.
Core Definition and Meaning of Even‑Strength Hockey Play

Even strength is when both teams ice the same number of skaters. Usually 5‑on‑5. It’s the default state, where most of the game actually happens.
Teams that win at even strength control the puck, the zone, and the chances. Teams that lose at even strength? They’re usually scrambling on special teams just to keep the score close.
At the start of one recent season, an NHL club posted 35 goals for and 29 against at 5‑on‑5. Sounds good. But their overall totals were 40 for and 41 against. That gap tells you their special teams gave back almost everything they’d built at even strength. When your power play or penalty kill is bleeding goals, it hides what’s working in the main part of the game. Analytics people focus on even strength because it strips out the noise and shows how a team performs in a fair fight.
Even‑strength situations include:
- 5‑on‑5 (standard, most common)
- 4‑on‑4 (less frequent, usually after offsetting minors)
- 3‑on‑3 (overtime only, fast and wide open)
- Delayed penalties (extra attacker before the whistle)
- Offsetting minors (even strength resumes right away)
- Matching coincidental penalties (equal skaters once both start)
Teams spend 75 to 85 percent of regulation at even strength. The best predictors of playoff teams aren’t power‑play percentages. They’re 5‑on‑5 goal differential, shot share, and expected‑goal rates. If you can’t generate chances or prevent them at even strength, you’re on borrowed time. Several scouting reports flag even‑strength scoring problems as the single biggest driver of missed playoffs, because you can’t lean on a hot power play for 82 games.
Even‑Strength Performance Metrics and Analytics Used in Hockey Evaluation

Teams measure even strength in layers. Goals first, then shot attempts, expected goals, high‑danger chances. The reason for isolating 5‑on‑5 is simple. Special teams skew totals, inflate point counts, and hide structural problems. When the Blue Jackets opened a season with 35 goals for and 29 against at 5‑on‑5, that +6 told a different story than the team’s overall ‑1 goal differential. The gap came from special teams giving back almost every gain.
Advanced metrics do more than count goals. They reveal how goals happen. Controlled entries, quick transitions, cycle pressure, lucky bounces. One team finished 25th in shot‑attempt share and 20th in expected‑goal share during 5‑on‑5 play. Those numbers pointed to consistent trouble controlling the puck and creating quality chances. Pairing possession metrics with expected‑goal models gives a clearer picture than wins and losses alone.
Seven core even‑strength analytical tools:
- Corsi – All shot attempts (shots on goal, missed shots, blocked shots) at 5‑on‑5. Measures puck possession.
- Fenwick – Shot attempts excluding blocks. Cleaner possession proxy when one team blocks heavily.
- Expected Goals (xG) – Probability‑weighted shot quality based on location, angle, type, and traffic.
- High‑Danger Scoring Chances (HDCF) – Shots from the home‑plate area (slot, crease, low circles).
- Rush Chances – Scoring attempts generated off the transition, before the defense is set.
- Cycle Chances – Opportunities created through sustained offensive‑zone possession.
- Zone‑Adjusted Shot Share – Corrects for zone starts and on‑the‑fly changes. Isolates neutral‑ice performance.
| Metric | What It Measures | Why It Matters |
|---|---|---|
| Corsi For % | Share of all shot attempts at 5‑on‑5 | Proxy for puck possession and territorial control |
| Expected Goals (xG) | Quality-weighted chance generation | Separates volume shooting from dangerous chances |
| Goals For per 60 | 5‑on‑5 goals scored per hour of ice time | Scoring rate normalized for playing time |
| High‑Danger Chance % | Share of slot and crease shots | Shows whether a team gets inside or settles for perimeter |
Player Impact at Even Strength and Goal‑Differential Evaluation
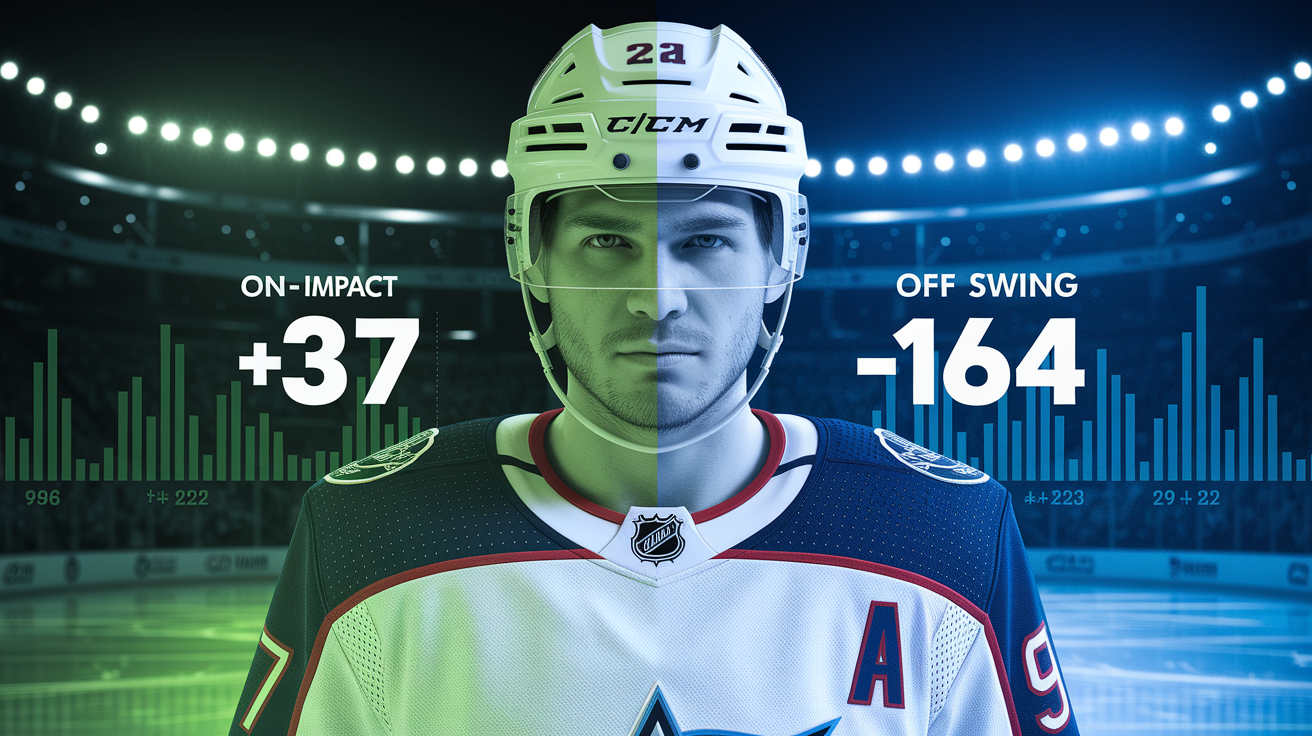
Individual even‑strength impact gets measured by comparing what happens when a player is on the ice versus when he’s on the bench. One method uses goal differential. How many more goals for than against when the player is out there, set against the team’s differential when he’s not. It isolates contribution beyond teammates and special teams.
Kirill Marchenko posted an even‑strength impact rating of 161 over 216 games. On ice, his team was +37 in goal differential at 5‑on‑5. Off ice, that same roster was ‑124. The 161‑point gap shows how much the team’s fortunes shifted with him in the lineup. Zach Werenski came in second at 147, Dmitri Voronkov third at 145, and Kent Johnson eighth at 94. Marchenko’s +14 edge over the next‑best player underlines how top‑heavy some rosters become. One injury to a player like that and the math changes fast.
Sample size and usage context matter. A player who starts 70 percent of his shifts in the offensive zone will post better goal differentials than a shutdown center deployed against top lines in his own end. Quality of competition, linemates, zone starts, and score effects all tilt the numbers. A winger riding shotgun with elite centers will show strong on‑ice rates even if his own play is average. That’s why goal‑differential impact should pair with other metrics. Corsi relative to teammates, expected‑goal rates, and shift‑by‑shift video. Before drawing conclusions about true ability.
Four contextual factors that shape even‑strength evaluation:
- Quality of competition – Facing top lines vs depth players changes chance quality and shot volume.
- Zone starts – Offensive‑zone faceoffs inflate possession and goals. Defensive starts suppress them.
- Linemates – Playing with strong two‑way forwards or puck‑movers boosts on‑ice results.
- Score effects – Leading teams sit back and allow more shot attempts. Trailing teams push and inflate Corsi.
Team‑Level Even‑Strength Trends and What They Reveal
A team’s 5‑on‑5 shot share and expected‑goal share predict record better than special‑teams percentages. One club finished 25th in total shot‑attempt share and 20th in expected‑goal share at even strength, then missed the playoffs despite decent goaltending stretches. The root cause wasn’t bad luck. It was consistent trouble controlling the puck in transition and generating clean entries. Teams that can’t tilt ice time and chances at even strength end up chasing the game, which burns out penalty killers and leaves power plays pressing to deliver every night.
The Blue Jackets opened a season 35–29 in 5‑on‑5 goals, a narrow positive margin. But that squad leaned on four players (Marchenko, Werenski, Voronkov, Johnson) for a disproportionate share of even‑strength production. Injuries hit any one of those four and the depth couldn’t replace the output. That’s the vulnerability built into top‑heavy rosters. Strong at even strength when healthy, fragile when the load shifts to secondary scoring.
| Team | Metric | Value | Interpretation |
|---|---|---|---|
| Blues (2025–26) | Shot‑attempt share | 25th | Consistently outshot; poor puck control at 5‑on‑5 |
| Blues (2025–26) | Expected‑goal share | 20th | Below‑average chance quality; struggle to generate high‑danger looks |
| Blue Jackets (start of season) | 5‑on‑5 goal ratio | 35 for, 29 against | Positive even‑strength play masked by special‑teams losses |
Even‑Strength Systems and Tactical Execution
A team’s 5‑on‑5 results flow directly from how they forecheck, defend the middle, and transition through the neutral zone. Strong forechecking systems force turnovers high in the zone and create rush chances before the defense can set. Weak forechecks let opponents break out clean, flip ice, and settle into cycle attacks. One team posted low shot‑attempt and expected‑goal shares because their forecheck lacked coordination. Gaps between forwards let opposing D‑men find easy outlets, and the neutral zone became a highway.
Forechecking & Pressure Systems
The 1‑2‑2 and 2‑1‑2 are the most common even‑strength forechecks. In a 1‑2‑2, the first forward pressures the puck carrier while the second and third read the breakout pass and angle to cut lanes. If the first forward gets beat clean, the middle layer collapses and the back two defend a 3‑on‑2 rush.
The 2‑1‑2 sends two forwards deep to deny the D‑to‑D pass and force a rim or chip. Both require fast reads on when to commit and when to peel back. Teams that mistime pressure end up chasing, which kills possession numbers and opens odd‑man breaks the other way.
Defensive‑Zone Structure and Shot Suppression
Tight gaps, active sticks, and layers between the puck and the net define good even‑strength defense. The most common system is a box‑plus‑one or collapsing man coverage that protects the home plate (slot and crease) while the weak‑side forward covers the point. Poor defensive teams let forwards drift high or lose net‑front position, which leads to screens, tips, and second chances.
Shot suppression at 5‑on‑5 comes from winning wall battles, clearing rebounds, and denying cross‑seam passes. If the opposition cycles freely, expected goals against will spike even if total shots stay average.
Neutral‑Zone Tactics for Limiting Controlled Entries
The neutral zone is where transition defense lives or dies. Teams that deny controlled entries force dump‑ins, which they recover 60 to 70 percent of the time. A tight 1‑3‑1 or 1‑2‑2 structure in the neutral zone funnels puck carriers to the boards and takes away the middle lane.
Weak neutral‑zone gaps let opponents walk in with speed and numbers, generating clean looks before the goalie is set. Coaches track zone‑entry success rates to diagnose whether their 5‑on‑5 defense is breaking down at the blue line or deeper in the zone.
Five common mistakes that hurt even‑strength results:
- Late gap closure in the neutral zone. Defender backing in too far, giving the rush clean ice.
- Failed clears under pressure. Soft rims or blind flips that don’t reach center.
- Lost wall battles in the defensive zone. Puck stays low, cycle continues, goalie gets screened.
- Overextended shifts. Fatigue leads to turnovers and blown assignments.
- Chasing the puck on the forecheck instead of angling to passing lanes. Creates odd‑man rushes against.
Even‑Strength Matchups, Deployment, and Coaching Decisions

Coaches control who plays against whom, where shifts start, and how long they last. A shutdown pair might start 60 percent of their shifts in the defensive zone and face the opponent’s top line every night. Their Corsi and goals‑for rates will look worse than a third pair sheltered with offensive‑zone starts. Reading deployment data tells you whether a player’s numbers reflect ability or usage.
The Blue Jackets’ top‑heavy even‑strength performance meant their best four players carried a disproportionate load. If Marchenko or Werenski missed time, the depth couldn’t replicate the impact. That roster design works until it doesn’t. One injury and the 5‑on‑5 goal differential flips.
The Blues faced a similar issue when one goaltender posted a 103‑point pace over 42 games and the other a 67‑point pace over 40. Switching who played more often would have materially changed results, but deployment decisions (starter confidence, contract politics, rest patterns) kept both in rotation longer than the numbers justified.
Lineup balance matters more at even strength than on special teams. A team that rolls four lines evenly can sustain forecheck pressure and keep shifts under 45 seconds. A team that leans on one line for 22 minutes a night at 5‑on‑5 will see that line’s performance drop in the third period, and the depth lines won’t have enough reps to stay sharp. Coaches who manage ice time well spread even‑strength minutes across the roster without sacrificing matchup advantages.
Four deployment levers coaches use to shape even‑strength outcomes:
- Zone starts – Offensive‑zone faceoffs to boost a scorer’s numbers. Defensive starts to insulate young players.
- Matchups – Line changes to get favorable pairings (speed vs size, puck‑movers vs forecheckers).
- Shift timing – Short shifts after icing or long defensive stands to keep legs fresh.
- Line stability – Keeping trios together builds chemistry. Frequent changes hurt reads and timing.
Even‑Strength Development: Skills, Training, and Player Pathways
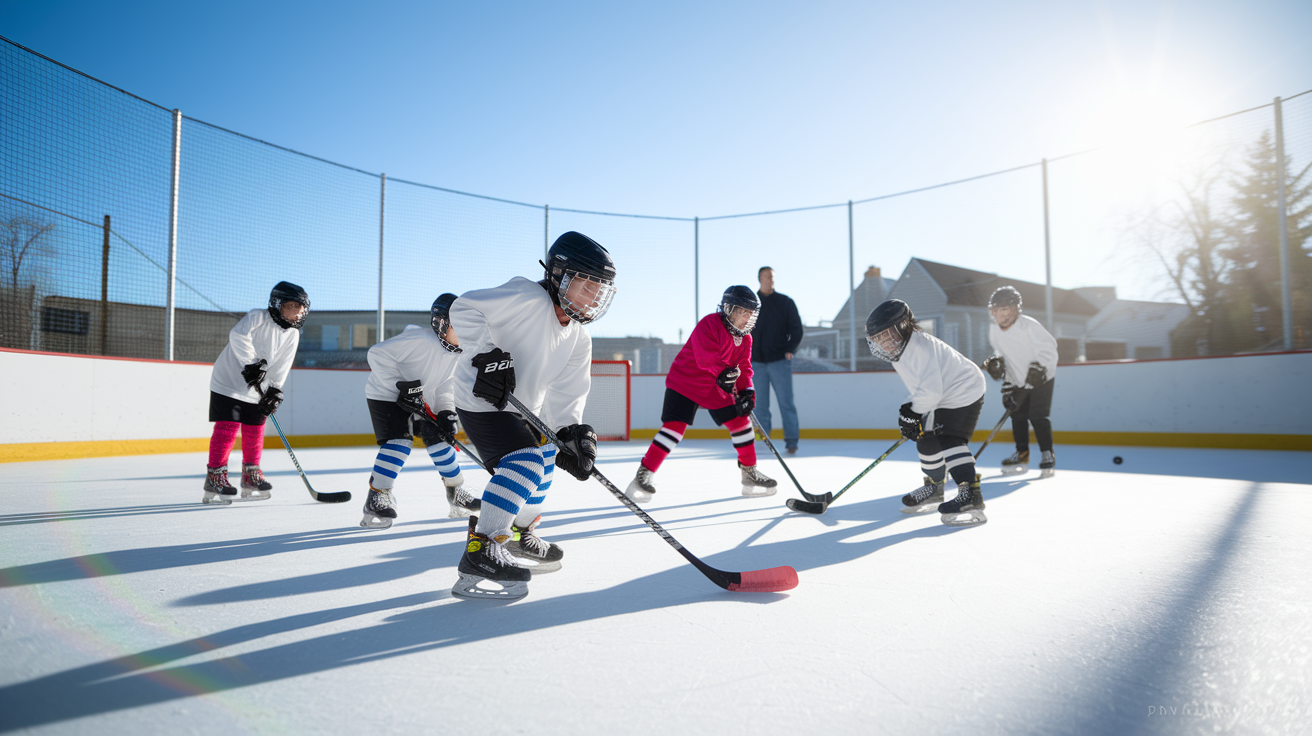
Building effective 5‑on‑5 players starts with fundamentals. Edges, puck protection, give‑and‑go timing, and reading the next play before it happens. Programs designed around even‑strength development focus on conditioning, game IQ, and creating a hard‑working, fast‑paced, positive environment. One development organization in Nova Scotia runs spring hockey, training camps, development sessions, and off‑ice work, all built to prepare players for the speed and decision‑making load of higher‑level 5‑on‑5 play. The goal is to give players the tools to progress and compete at the next level, whether that’s high school, junior, or beyond.
Effective even‑strength training isolates the skills that matter most in real shifts. Quick transitions, tight gaps, wall play, and cycling under pressure. Small‑area games teach players to make decisions in traffic and protect pucks with body position. Skating drills for gap control build the footwork to close on a rush without getting walked.
Cognitive drills (where a coach calls out scenarios mid‑drill) sharpen reads and pattern recognition. The best development programs layer these pieces together so players don’t just skate faster or shoot harder. They learn when to jump, where to support, and how to win 50‑50 pucks that tilt possession.
Five core areas of even‑strength skill development:
- Puck protection and body positioning – Using the body to shield the puck in tight spaces.
- Transition skating and crossovers – Speed through the neutral zone and tight turns in all three zones.
- Wall battles and board work – Winning loose pucks along the half wall and behind the net.
- Give‑and‑go timing and support angles – Finding open ice and hitting the pass in stride.
- Defensive gaps and stick positioning – Closing space without lunging, keeping the stick in passing lanes.
Examples of Real‑World Even‑Strength Performance From Recent NHL Seasons

Kirill Marchenko’s 161 even‑strength impact rating over 216 games with the Blue Jackets shows what happens when one player drives results in a fair fight. On ice at 5‑on‑5, his team was +37 in goals. Off ice, the same roster was ‑124. That’s a 161‑goal swing. More than two full seasons’ worth of goal differential hinging on whether one winger was on the bench or on the ice.
Zach Werenski (147) and Dmitri Voronkov (145) were close behind, but the gap between Marchenko and the next tier underlined how fragile the depth was. When your top‑four even‑strength producers account for that much of the margin, injuries or a cold stretch can sink a season.
The Blues’ 2025–26 season offered a different lesson. Even if a team posts a narrow positive goal differential at 5‑on‑5, possession and chance quality tell the real story. They finished 25th in shot‑attempt share and 20th in expected‑goal share, meaning they were consistently outchanced and outshot. Goaltending masked some of the problem (Joel Hofer’s 103‑point pace over 42 games vs Jordan Binnington’s 67‑point pace over 40), but the underlying even‑strength structure was shaky.
Injuries and down‑year performances from key contributors made it worse, and the club missed the playoffs by four points. The takeaway? You can survive weak 5‑on‑5 possession for stretches if goaltending or special teams bail you out, but over a full season the cracks show.
| Team | ES Metric | Outcome |
|---|---|---|
| Blue Jackets (early season) | 5‑on‑5 goals: 35 for, 29 against | Positive even‑strength play; overall record hurt by special teams |
| Blues (2025–26) | Shot‑attempt share: 25th; xG share: 20th | Poor possession and chance quality; missed playoffs despite stretches of strong goaltending |
| Blue Jackets (Marchenko impact) | On‑ice +37, off‑ice ‑124 at 5‑on‑5 | Top‑heavy roster highly vulnerable to injury or regression |
Final Words
Right in the action: we laid out what even-strength means (5-on-5), the key metrics to watch, how player impact and team systems change outcomes, and practical development steps coaches and players can use.
Next, use the numbers, like 5v5 goals, xG and on-ice differentials, to judge players and teams. Focus practice on possession, zone entries and defensive structure. Watch matchups and deployment. Small changes often move the needle.
Keep it simple, drill the basics, and the payoff in even strength will follow.
FAQ
Q: What is even strength?
A: Even strength is hockey played with equal skaters—usually 5-on-5—where neither team has a man advantage. It’s the baseline for possession, scoring rates, and analytic measures of team performance.
Q: Is Wayne Gretzky intelligent?
A: Wayne Gretzky is widely regarded as exceptionally hockey-intelligent, known for elite vision and anticipation on the ice, plus solid business and media judgment in his post-playing career.
Q: Who is predicted to win the Stanley Cup in 2026?
A: Predicted Stanley Cup winner for 2026 isn’t settled. Odds shift with trades, injuries, coaching, and 5v5 metrics—check current betting lines and even-strength performance for the best up-to-date picks.
Q: Why can’t you wear 69 in hockey?
A: You can’t wear 69 in hockey because most leagues and teams ban or discourage it due to its sexual connotation, professionalism, and merchandising concerns; some permissive leagues still allow it.