
If you still judge a hockey game by shot totals, you’re missing the story.
Game tape hides the real causes: positioning, timing, and the moments that swing momentum.
This step-by-step guide shows the proven methods coaches and scouts use to break a game down.
You’ll learn what to watch live, how to take useful notes, and which metrics actually matter.
By the end you’ll have a repeatable routine to turn what you see into clear, actionable insights.
Core Steps to Analyzing a Hockey Game

Hockey game analysis is breaking down what you’re watching into patterns, events, and decisions that explain why the game went the way it did. Coaches use it to build better plans. Scouts use it to evaluate talent. Fans use it to actually understand what’s happening beyond the scoreboard.
If you’re new to this, don’t try to track everything. Pick a few things you can watch consistently. Where do players stand relative to the puck? Which team controls how they enter the zone? Who’s creating real chances versus just throwing pucks at the net? You’re building a habit first. Complexity comes later.
A step-by-step process keeps your analysis sharp and your notes worth reading later. Here’s what every beginner should focus on:
- Observe player positioning – Notice where forwards, defensemen, and the puck carrier are in relation to each other and the boards.
- Note puck movement patterns – Is the puck moving through controlled carries, quick passes, or dump-ins?
- Track shots and scoring chances – Count shots, but separate routine perimeter attempts from high-danger slot chances.
- Monitor special teams – Power-play setups and penalty-kill coverage tell you a lot about coaching and execution.
- Evaluate transitions – Watch how teams move the puck out of their zone and cross the offensive blue line.
- Summarize game flow – After each period, write one sentence about which team controlled play and why.
Pre‑Game Preparation for Effective Analysis

Analysis doesn’t start when the puck drops. Check recent results. Look at injury reports. Figure out what the opposing team likes to do. If their top defenseman is out, the breakout changes. If a key center just came back from injury, you want to see how much ice time he gets. These details tell you what to watch for.
Team systems matter just as much as personnel. A 1-2-2 forecheck sends one forward deep and two others to the hashmarks, trying to force turnovers at the blue line. A passive 2-3 keeps forwards higher and relies on speed to counter. If you know the system a team runs, you’ll spot when they bail on it under pressure.
Identify key players and matchups. Which line does the coach use against the opponent’s top scorer? Which goalie is starting, and what’s his recent save percentage? Write this stuff down in a notebook or a digital file before the game starts.
Before you watch, gather this:
- Recent win/loss record and trends on offense and defense
- Injury updates and lineup changes
- Team forechecking and neutral-zone systems
- Special-teams personnel and power-play setups
Live Observation and Real‑Time Note Taking
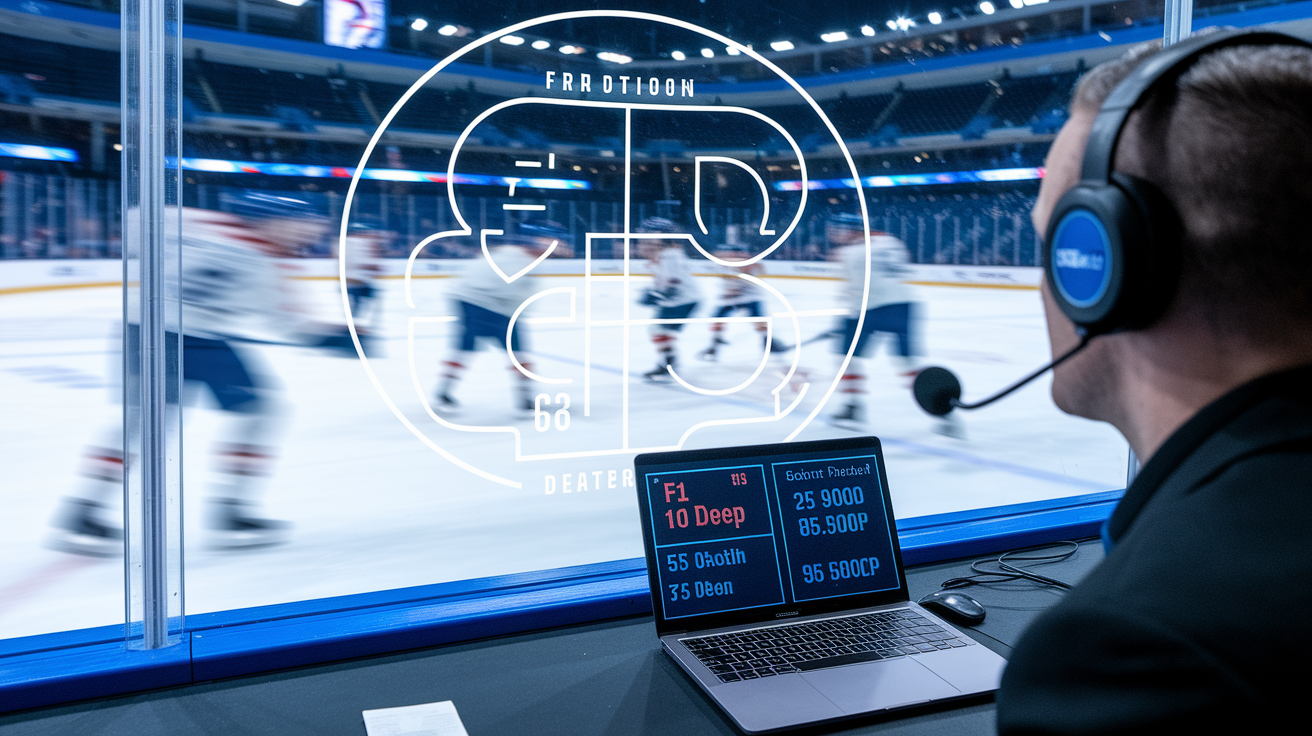
Live analysis means watching with purpose and writing down what you see as it happens. You’re reading the structure of the play, not just following the puck. Notice how the defensive team positions itself when the opponent enters the zone. Do forwards support the defenseman on the wall, or do they cheat toward the middle looking for a chance?
Identifying systems in real time takes reps. A 1-2-2 forecheck looks like one forward pressuring behind the net while two teammates wait near the dots. A 2-1-2 neutral-zone trap shows two forwards clogging the middle while the third stays high. Breakouts reveal whether a team prefers quick up-the-middle passes or controlled wall carries. Use shorthand notes like “F1 deep, F2/F3 dots” or “D-to-D stretch pass” so you can piece together the sequence later.
Tracking game flow means noting which team controls the pace. If one team spends three minutes in the offensive zone generating chances, that’s momentum. If the other team answers with a quick goal on a counter-rush, the flow shifts. Mark these turning points. They often explain final scores better than total shot counts.
Key In‑Game Elements to Watch
Turnovers matter more than possession totals. A turnover at the offensive blue line often leads to an odd-man rush the other way. Track where turnovers happen and which players cause them.
Zone time shows which team is dictating play. If a team holds the puck in the offensive zone for 90 seconds, they’re wearing down the defense even if they don’t score. Note which line generates extended shifts in the attacking end.
Shot quality separates real threats from low-percentage attempts. A point shot through traffic isn’t the same as a one-timer from the slot. Mark high-danger chances with an asterisk or a different pen color.
Faceoff outcomes set up zone entries and defensive-zone clears. A clean win in the defensive zone often leads to a controlled breakout. A loss can pin a team in its own end for an entire shift. Track faceoff results in key situations like power plays or late-period offensive-zone draws.
Tracking In‑Game Metrics and Data Points

Metrics turn what you see into something you can compare. Tracking basic stats during a live game helps you catch patterns that are easy to miss when you’re caught up in the action. You don’t need advanced software to start. A notebook and a pen work fine for counting shot attempts, noting zone entries, and marking high-danger chances.
The simplest way to track metrics is to draw a small rink diagram and use tally marks or shorthand codes. Mark every shot attempt with a dot in the zone where it happened. Use a different color for high-danger chances. At the end of the period, count your marks. Even rough counts reveal which team controlled the slot and which team settled for perimeter shots.
| Metric | What It Measures | Why It Matters |
|---|---|---|
| Corsi (shot attempts) | All shots, blocks, and misses at even strength | Shows puck possession and offensive pressure over time |
| Expected Goals (xG) | Quality of scoring chances based on shot location and type | Predicts goals better than raw shot totals |
| High-Danger Chances | Shots from the slot or home-plate area | Most goals come from this zone; volume here drives outcomes |
| Zone Entries | Controlled carries or passes across the blue line | Controlled entries generate more sustained pressure than dumps |
| Special Teams % | Power-play goals per opportunity and penalty-kill success rate | Special teams often decide one-goal games |
Post‑Game Review and Performance Evaluation

Reviewing game footage after the final buzzer lets you catch details you missed in real time. Rewind sequences where goals were scored and watch the 15 seconds before the shot. Did a defenseman pinch too aggressively? Did a forward lose a board battle and give up a two-on-one? Slow-motion review shows mistakes that look like bad luck at full speed.
Compare your live notes to what actually happened. If you wrote “Team A controlled the second period,” check the shot-attempt totals and zone-time estimates. If the numbers disagree with your impression, figure out why. Maybe one team generated chances in bunches but the goalie made three highlight saves. Maybe the other team scored on a power play and you over-weighted that goal when evaluating the period.
Identify patterns across multiple viewings. If a defenseman gets beaten wide three times, that’s a trend. If a forward consistently loses faceoffs on his backhand, that’s actionable information. Write objective assessments that include evidence. “Player X struggled in transition because he turned the puck over twice at the red line and got caught flat-footed on a two-on-one” is more useful than “Player X had a bad game.”
After the review, complete these steps:
- Watch all goals and high-danger chances frame by frame to identify root causes
- Cross-check your live counts (shots, zone entries, turnovers) against official stats if available
- Write a short summary highlighting the two or three factors that decided the outcome
Tools, Software, and Templates for Hockey Analysis

The right tools make tracking faster and your data easier to review. Video editing software lets you clip sequences, slow down plays, and mark timestamps for later reference. Stats trackers help you log events without losing focus on the screen. Standardized templates keep your notes consistent from game to game.
You don’t need expensive setups to start. Free or low-cost options work well for beginners. A spreadsheet can store shot locations, zone entries, and player-specific notes. A simple video player with one-second rewind and keyboard shortcuts is enough to review sequences. As you get more serious, you can add shot-plotting tools that let you click event locations on a rink diagram and export the data to a CSV file for deeper analysis.
Common tools and resources include:
- Video players with precise controls – VLC or platform-native apps; configure one-second skipback to review events frame by frame
- Shot-plotting and event-location tools – Free rink diagram software that logs coordinates and exports to spreadsheet formats
- Spreadsheet templates – Pre-built Excel or Google Sheets files with columns for Event, Period, Time, Player, Location, and Result
- Notebook and pen – Low-tech backup for live games when screens aren’t practical; draw rink zones and use tally marks
- Screen recording software – Capture and annotate live streams for post-game breakdown when official footage isn’t available
Final Words
You’re in the action—tracking positioning, zone entries, shot quality, and the small moments that change games. The post walked through core steps, pre‑game prep, live note taking, metrics to track, post‑game review, and the tools that speed the work.
Use the checklists and templates, rewatch key shifts, and focus on a few metrics at a time. This approach makes it easier to learn how to analyze a hockey game step by step and get better each week.
FAQ
Q: How to analyse a hockey game?
A: To analyse a hockey game, watch player positioning, track puck movement and zone entries, record shot quality and chances, monitor special teams and transitions, then summarize game flow and key moments for next steps.
Q: Has a black person ever won the Stanley Cup?
A: A Black person has won the Stanley Cup; several Black players and staff have been part of Cup-winning teams, notably goalie Grant Fuhr with the Edmonton Oilers in the 1980s.
Q: What are the 4 pillars of hockey?
A: The four pillars of hockey are skating, puck skills, hockey sense (decision-making), and compete (work ethic and physicality), each essential for practical play, selection, and development.
Q: What are the 5 basic rules of hockey?
A: The five basic rules of hockey are offside, icing, penalties (illegal sticks and holds), high-sticking, and faceoff procedures; these keep play safe, fair, and orderly.