
Plus-minus is broken. Want something better?
A real grading system measures what actually happened on the ice, not who happened to be standing there when the puck went in.
In this post you’ll get a replay-first framework with a clear numeric scale, scoring-chance plus/minus, time-and-matchup weighting, and position-specific metrics.
You’ll learn how to assign credit and blame on each scoring sequence, normalize by ice time, and turn messy plays into fair, repeatable grades that tell coaches and players what to train next.
Building a Complete Framework for a Hockey Player Performance Grading System
A hockey player performance grading system needs to measure what actually happens on the ice, not what appears on the scoreboard. You can’t build an effective system without a numeric scale that has clear descriptors, a method for tracking individual contributions to scoring chances, and a data workflow that captures plays most official stats miss. The system works because it focuses on momentum sequences. You’re tracking every contributor to a scoring chance from the moment your team gains or loses control until the opposition has firm, safe possession.
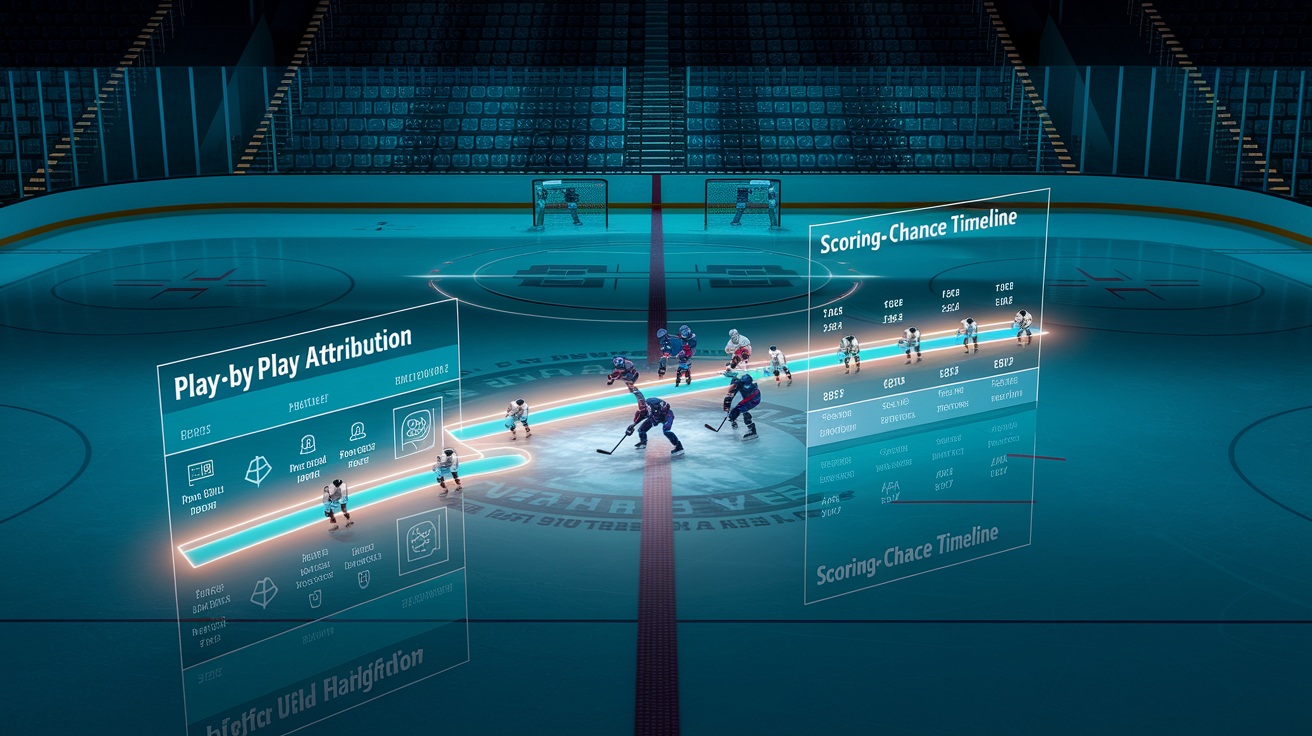
Official statistics capture only the last three players to touch the puck before a goal. Everyone on ice for a goal against gets a blanket minus-one. That approach makes individual grading nearly impossible. A proper grading framework replays key moments five to ten times in slow motion, assigns credit and blame play by play, and builds a personalized scoring-chance plus/minus that reflects what each player actually contributed. Scoring chances matter more than goals because single-game results are often driven by luck. A goalie’s hot night, a post, a fortunate bounce. Grading on chances captures performance independent of outcome.
The replay-based method increases accuracy because it lets you see who won the wall battle that started the rush, who made the first pass out of the zone, who provided net-front traffic, and who lost gap control on the rush against. Without the ability to rewind and review, you’re left guessing. Or relying on memory, which consistently misses secondary contributors and misjudges responsibility on goals against.
Every functional hockey grading system must include these six elements:
A numeric grading scale with descriptors for each level. A method for tracking scoring-chance contributions and assigning individual credit or blame. Context adjustments for time on ice, line matchups, and special situations. Position-specific evaluation criteria that account for role differences. A data workflow that allows replay review and accurate attribution. A simple recording template that captures both scoring sequences and major game events.
Key Performance Indicators to Include in a Hockey Grading System
Scoring chances form the backbone of any grading system, but they need support from other measurable events that reveal player impact. Big defensive stops. A blocked cross-ice pass in the slot, a stick lift that kills a two on one, a body position that forces a shooter wide. These show game-changing contributions that don’t appear in traditional box scores. The same applies to ugly turnovers, the kind that gift the opposition a prime chance. Tracking these events separately ensures they carry appropriate weight in the final grade.
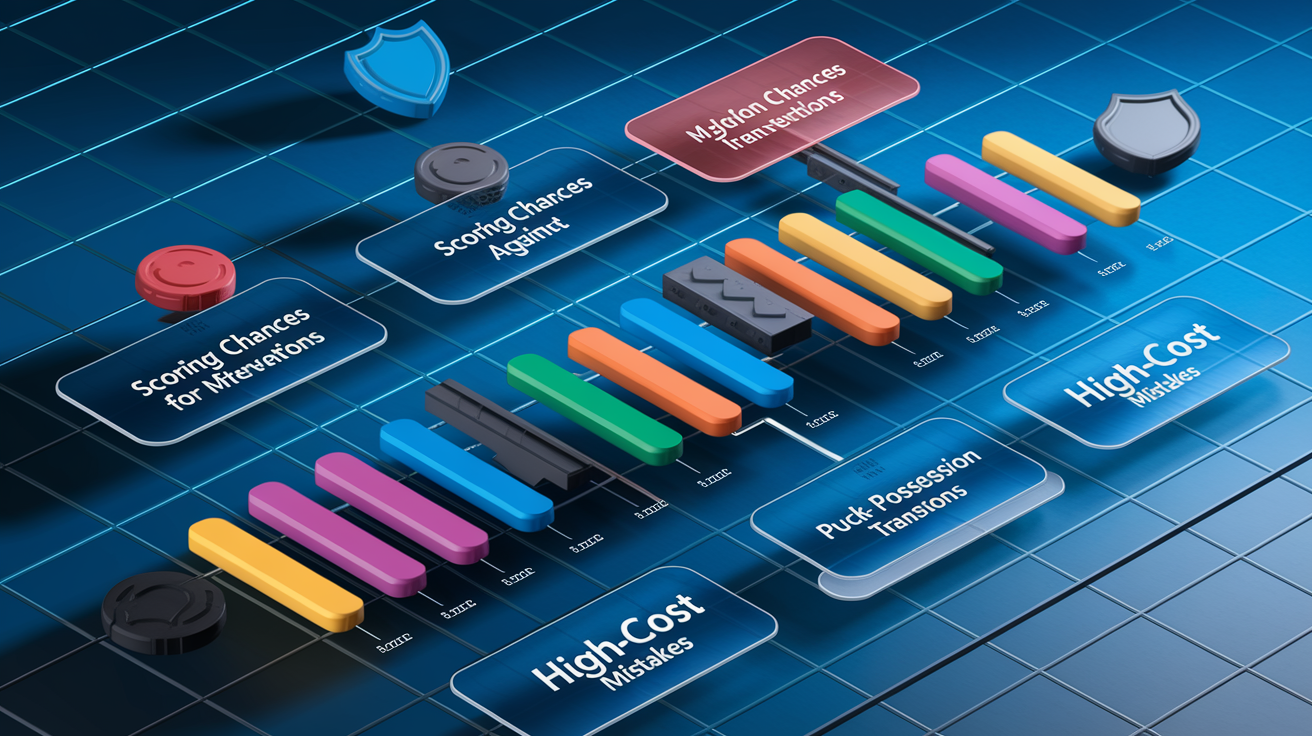
The five core KPIs for game-string evaluation are:
Scoring chances for (number of quality opportunities a player contributed to). Scoring chances against (number of quality opportunities a player was responsible for allowing). Major defensive interventions (blocked passes, broken-up odd-man rushes, gap closures). Puck-possession transitions (clean zone exits, successful retrievals, maintained offensive-zone time). High-cost mistakes (turnovers leading directly to dangerous chances, blown coverage assignments).
Future refinements should consider adding measurable components like puck-battle wins. Marking each wall battle, board battle, or net-front battle with a simple checkmark for the winner. That metric captures physicality and compete level in a reproducible way. Similarly, tracking shots from high-danger areas versus perimeter shots gives a clearer picture of offensive quality than raw shot totals. The goal is to build a complete snapshot of what a player did and didn’t do every shift, not just what the official scoresheet happened to record.
Designing the Grading Scale for Hockey Game Evaluations

The grading scale translates observed performance into a single comparable number. A ten-point scale offers enough resolution to distinguish levels without creating meaningless micro-distinctions. Each number on the scale should carry a short descriptor that defines what kind of game earns that grade, making evaluations consistent across different games and evaluators.
Start with anchor points at the top and bottom of the scale, then fill in the middle with clear performance boundaries. A 10 represents a perfect game. No mistakes, dominant in all situations, the kind of performance that stands out even years later. A 1 marks a game so poor the player looked like they didn’t belong at that level. The middle of the scale, from 4 to 7, captures the range where most NHL games fall. Below average, average, above average, and good. These descriptors must be honest and direct.
| Grade | Descriptor |
|---|---|
| 10 | Perfect game, no mistakes, dominant throughout |
| 5 | Average performance for the level, neutral impact |
| 1 | Doesn’t belong at this level based on that game |
Using descriptors like “extraordinary,” “great,” “good,” “above average,” “average,” “below average,” “poor,” and “terrible” for the spaces between keeps the scale interpretable. When a player logs a 7, you know immediately they had a good game. Solid contributions, few mistakes, positive overall impact. When they log a 3, the game was poor, with multiple costly errors or ineffective shifts. The scale should feel intuitive to anyone who watches hockey regularly.
Weighting and Normalizing Data Within a Hockey Grading System

Raw event counts don’t tell the full story because context changes everything. A player who logs twenty-two minutes against the opposition’s top line while posting a plus-three in scoring chances contributed more than a player who logs nine minutes of sheltered third-line minutes with a plus-four. Time on ice adjustments capture that difference. High ice time should bump a grade upward when performance holds steady, because managing fatigue and maintaining quality over long shifts is a skill in itself.
Matchup adjustments account for competition level. If a defenseman faces McDavid and Draisaitl for twelve minutes and breaks even on scoring chances, that’s a win. If a fourth-liner is on ice for three goals against while facing an opponent’s fourth line, that’s a loss. Special situations require separate treatment. A power-play goal against isn’t always a defensive failure if no individual mistake caused it. Mark those sequences with a note like “PP” and exclude them from individual blame, or weight them differently.
The five-step weighting process works like this:
Collect raw event totals. Scoring chances for, scoring chances against, major events tracked. Normalize by time on ice. Divide totals by minutes played to create per-minute rates, then compare against typical rates for that position and role. Apply matchup adjustments. Increase the value of positive contributions when facing elite competition, decrease the penalty for chances against in the same situations. Adjust for special situations. Separate power-play and penalty-kill sequences, apply role-specific expectations for each. Calculate the composite score. Combine weighted scoring-chance balance with major-event contributions, then map the result onto your grading scale.
This process converts raw numbers into a fair, context-aware grade. It’s more work than tallying plusses and minuses, but it produces grades that reflect what actually happened on the ice instead of what the scoreboard or shot clock happened to show.
Position-Specific Evaluation Criteria for Forwards, Defensemen, and Goalies
Forwards
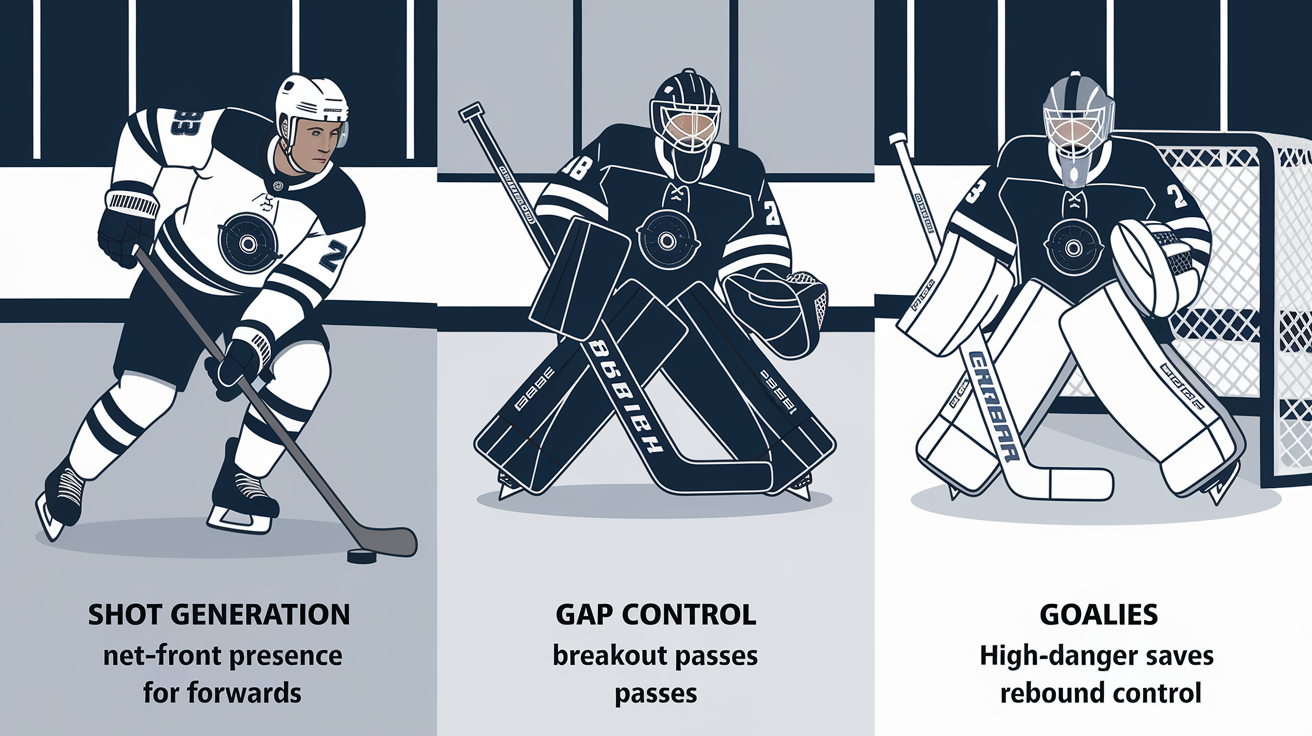
Forwards are graded primarily on offensive-zone impact and puck retrieval. The best forwards create multiple scoring chances per game through net-front presence, puck distribution, and shot generation. They also recover loose pucks in all three zones, win wall battles, and maintain offensive-zone time by making the right play under pressure.
Key evaluation points for forwards include:
Shot generation from high-danger areas (slot, net-front, one-timers). Net-front presence on scoring chances (screens, tips, rebounds). Puck retrieval and wall-battle success rate. First-pass execution on breakouts and transition plays.
Defensemen
Defensemen are graded on coverage reliability, gap control, and breakout execution. A strong defensive game means limiting high-danger chances against through body position, stick work, and communication. Offensively, defensemen need to execute clean first passes out of the zone, join the rush at the right time, and manage the offensive blue line without giving up odd-man rushes the other way.
Key evaluation points for defensemen include:
Gap control and denial of clean zone entries. Defensive-zone coverage (net-front, weak-side rotation, board battles). Breakout pass accuracy and decision-making under pressure. Offensive blue-line management (keeping pucks in, recognizing when to pinch).
Goalies
Goalies are graded on high-danger save performance and rebound control. A goalie who stops twelve of thirteen high-danger chances had a better game than one who stopped thirty-two of thirty-five low-danger shots. Rebound control matters because second chances are almost always higher quality than the initial shot. Positioning, recovery speed, and communication with defensemen all contribute to the grade.
Key evaluation points for goalies include:
Save percentage on high-danger chances (slot shots, cross-ice one-timers, breakaways). Rebound control and second-chance prevention. Positioning and angle management on initial shots. Recovery speed after the first save or a scramble.
Creating an In-Game Player Rating System Using Scoring Chances

An in-game rating system built on scoring chances requires clear rules for when to start and stop tracking a sequence. Begin tracking the moment your team gains or loses momentum. If that’s a defenseman winning a puck battle deep in your own zone, the sequence starts there. Continue tracking every player who contributes to moving the puck up ice, entering the offensive zone, and creating the scoring chance. Stop tracking when the opposition has firm, safe control of the puck.
Assign a plus-one to every player who made a positive contribution to a scoring chance for. That includes the player who won the initial puck battle, the player who made the breakout pass, the player who carried the puck into the zone, the player who set a screen, and the player who took the shot. Multiple players can earn credit on a single chance. On scoring chances against, assign a minus-one to each player whose mistake or poor positioning contributed to the chance. That might be the forward who lost the wall battle, the defenseman who got walked at the blue line, or the backchecking winger who didn’t pick up the late trailer.
| Start Trigger | Contributors | Culprits |
|---|---|---|
| Defenseman wins puck battle deep in own zone | Defenseman (+1), center making breakout pass (+1), winger carrying into zone (+1), second winger setting screen (+1), shooter (+1) | None |
Replay each sequence five to ten times to ensure fair attribution. In real time, it’s easy to miss the second assist or the defender who lost a step at the blue line. Slow motion and multiple reviews catch those details. Ignore the official plus/minus entirely. It assigns blame to everyone on the ice regardless of who actually made the mistake, and it gives no credit to players who contributed to a scoring chance that didn’t result in a goal. Your personalized scoring-chance plus/minus, built play by play, is far more accurate.
Data-Collection Tools and Workflow for Hockey Game Grading

The most reliable data method uses a PVR or digital video platform that allows instant replay, slow motion, and frame-by-frame review. Recording the game and watching it back with full rewind capability lets you catch details you’ll miss in live viewing. Replay key moments five to ten times. Once at full speed to see the flow, once in slow motion to see the details, then additional reviews as needed to assign fair credit and blame.
A two-column paper sheet works as a backup or primary tracking tool. Label one column “Scoring Chances For,” the other “Scoring Chances Against,” and tally player numbers with plus-one or minus-one marks as sequences unfold. At the bottom of the page, add a section for major events. Big defensive stops, big hits, big saves, ugly turnovers. Mark each event with a player number and a short note. This low-tech method is fast, portable, and requires no special equipment beyond a pen and a printed template.
The four ideal tools for efficient data capture are:
Video replay capability (PVR, streaming platform with rewind, or tablet recording). Slow-motion review function to analyze body position, stick placement, and puck movement frame by frame. Wearable sensor technology (GPS trackers, accelerometers) for objective speed, distance, and effort data when available. Manual backup sheets (printed templates or a notebook) to record observations when technology fails or isn’t accessible.
Future additions might include automated puck-tracking systems that log possession time, zone entries, and shot locations without manual input. Until that technology becomes widely accessible, manual tracking combined with video review remains the gold standard for accurate, reproducible grading.
Templates and Forms for Building a Hockey Player Evaluation System

A simple template keeps data organized and ensures you capture all relevant information. The basic structure includes two main columns for scoring-chance tracking, a section for major events, and a summary area for the final composite grade. Each field serves a specific purpose, and the layout should make it easy to tally totals and spot patterns at a glance.
| Field | Purpose |
|---|---|
| Scoring Chances For | Tally +1 marks for each player contributing to offensive scoring chances |
| Scoring Chances Against | Tally −1 marks for each player responsible for defensive breakdowns leading to chances against |
| Major Events Log | Record big defensive stops, hits, saves, turnovers with player number and brief description |
| Final Composite Grade | Combine scoring-chance balance, major events, and context adjustments into a single 1–10 grade |
The template should fit on a single page. At the top, include spaces for game date, opponent, and ice conditions. In the middle, place the two-column scoring-chance tracker with room for at least twenty entries per column. At the bottom, reserve four or five lines for the major-events log. In the lower right corner, add a small box for the final grade and a line for notes explaining the grade.
This layout supports fast, in-game recording without flipping pages or searching for the right section. After the game, totals are easy to calculate, and patterns become immediately visible. Like a player consistently earning plus-one marks on the forecheck or repeatedly showing up in the “turnovers” section.
Ensuring Consistency, Accuracy, and Fairness in a Hockey Grading System

Consistency across games and evaluators requires calibration sessions where multiple graders watch the same game footage and compare scores. Differences in interpretation reveal where the rubric needs clarification. If one grader gives a player a 6 and another gives a 4 for the same performance, the descriptors or attribution rules aren’t clear enough. Run calibration sessions at the start of each season and any time a new evaluator joins the team.
Bias reduction starts with awareness. Confirmation bias makes you see what you expect. If you think a player is struggling, you’ll notice every mistake and overlook contributions. Combat this by grading the jersey number, not the name, during the first pass through the footage. Recency bias weights the most recent shift too heavily, so review the full game before assigning a grade. Star-player bias inflates grades for high-profile athletes and deflates grades for depth players. Counter it by applying the same attribution rules and standards regardless of reputation.
Five methods to maintain reliability and fairness are:
Conduct regular calibration sessions with multiple evaluators reviewing the same footage. Grade blind when possible. Watch the jersey number, not the nameplate, on the first pass. Use video replay rather than live observation to reduce the impact of real-time emotional reactions. Document scoring-chance sequences in writing so another evaluator could independently verify the attribution. Review and adjust the system regularly based on what does and doesn’t capture meaningful performance differences.
Scoring-chance tracking must be reproducible. If two people watch the same sequence, they should arrive at the same list of contributors and culprits. When discrepancies arise, discuss the decision points. Who won the board battle, whose pass broke the puck out, whose gap control failed. And refine the rules until the process is clear enough that any trained evaluator would reach the same conclusion.
Turning Player Grades Into Development Plans and On-Ice Improvement

Player grades reveal patterns that direct training priorities. A forward who consistently logs high scoring-chance totals but rarely finishes is a shooting-accuracy candidate. A defenseman who earns multiple minus-one marks for gap-control failures needs one on one skating and angling work. A goalie who stops the initial shot but gives up rebounds on seventy percent of scoring chances needs rebound-control drills. The grade alone doesn’t drive improvement. The breakdown of how the grade was earned does.
Link specific grade components to measurable training goals. If a player’s turnovers in the neutral zone cost them two full grade points over a five-game span, the development plan should include neutral-zone puck protection under pressure, scanning habits before receiving passes, and decision-making drills that simulate game-speed reads. Track improvement by re-grading the same player in similar situations over the next ten games. If turnovers drop and the grade climbs, the training worked.
Four ways to connect metrics to training priorities are:
Identify the two or three most frequent negative events in a player’s grade breakdown and design drills that address those specific situations. Celebrate consistent positive contributions by incorporating those skills into the player’s defined role and giving them more opportunities to deploy those strengths. Use video clips from graded games to show players exactly what earned credit and what caused blame, making feedback concrete instead of abstract. Set measurable targets for the next grading period. Reduce defensive-zone turnovers from five per game to two, increase scoring-chance contributions from plus-two to plus-four. And track progress game by game.
The system works because it separates outcome from process. A player who creates four high-danger chances in a game but doesn’t score still earns a strong grade. That player doesn’t need to change what they’re doing. They need to keep creating chances and trust that the goals will come. Conversely, a player who scores twice on broken plays but posts a minus-three in scoring chances and multiple turnovers didn’t actually play well. The grade captures that reality and points toward the real areas for improvement, even when the box score tells a different story.
Final Words
In the action, you’ve built a usable grading framework: a 1-10 scale with clear descriptors, scoring-chance first approach, +1/-1 attribution, replay review, position criteria, weighting, and templates.
That matters because grades should point practice and cut through noisy box scores. Use KPIs and consistent workflows so grades are fair and repeatable.
Use this roadmap on how to create a player performance grading system for hockey games: start with one game, calibrate with a partner, and turn grades into focused practice. It works. Stick with it and watch players improve.
FAQ
Q: What is the 80 20 rule in hockey?
A: The 80/20 rule in hockey is the idea that roughly 80% of results come from 20% of causes, so prioritize the few high-impact players, plays, and skills that drive most game outcomes.
Q: What performance tests are done for hockey players?
A: The performance tests done for hockey players include on-ice speed and agility sprints, off-ice strength and power tests like vertical jump, endurance tests (beep/VO2), and skill checks for shooting and puck control.
Q: How to calculate PPG in hockey?
A: PPG in hockey is calculated by dividing a player’s total points (goals plus assists) by games played, giving points per game to compare scoring rates across players or seasons.
Q: What is a good sv% in hockey?
A: A good sv% in hockey depends on level, but generally around .915 is solid and .920+ is very good to elite; always judge by league, team, and game context.