
What if goals and assists are the last things you should look at when judging a shift?
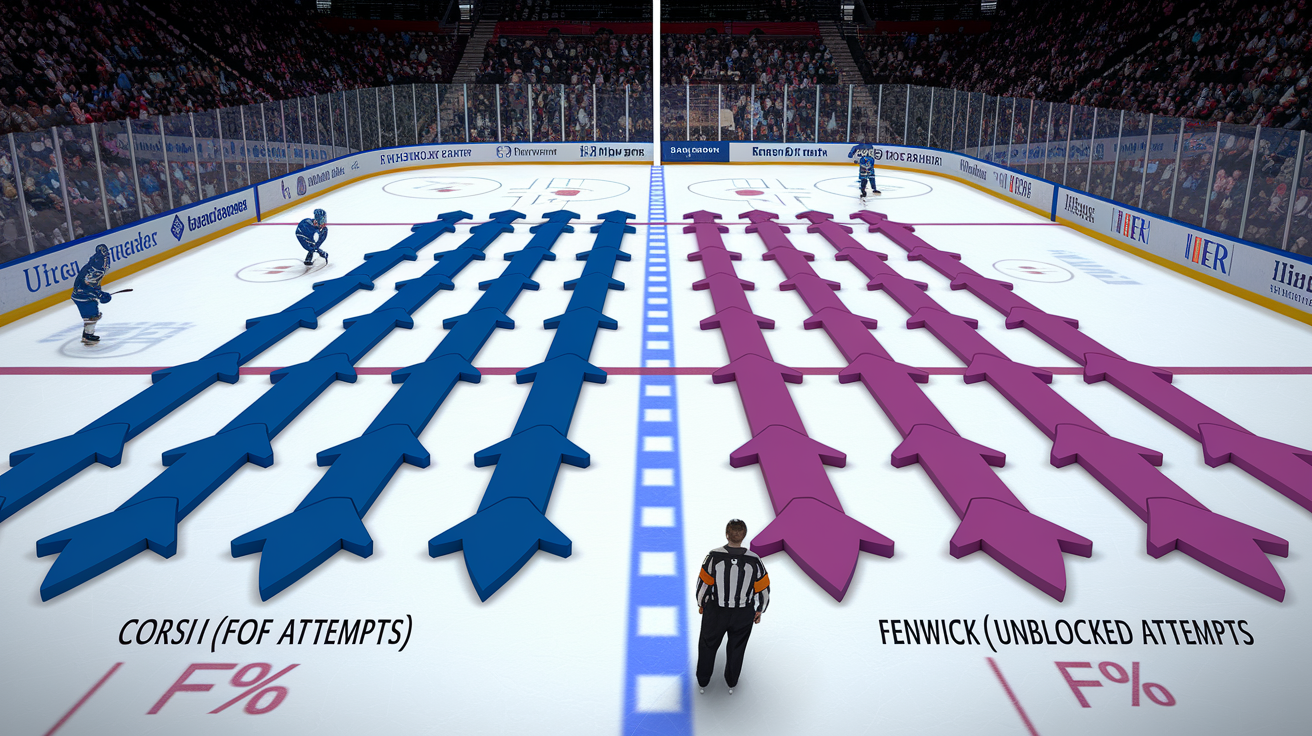
Corsi and Fenwick aren’t fancy tricks.
They’re shot-attempt counts that show who spends more time in the offensive zone.
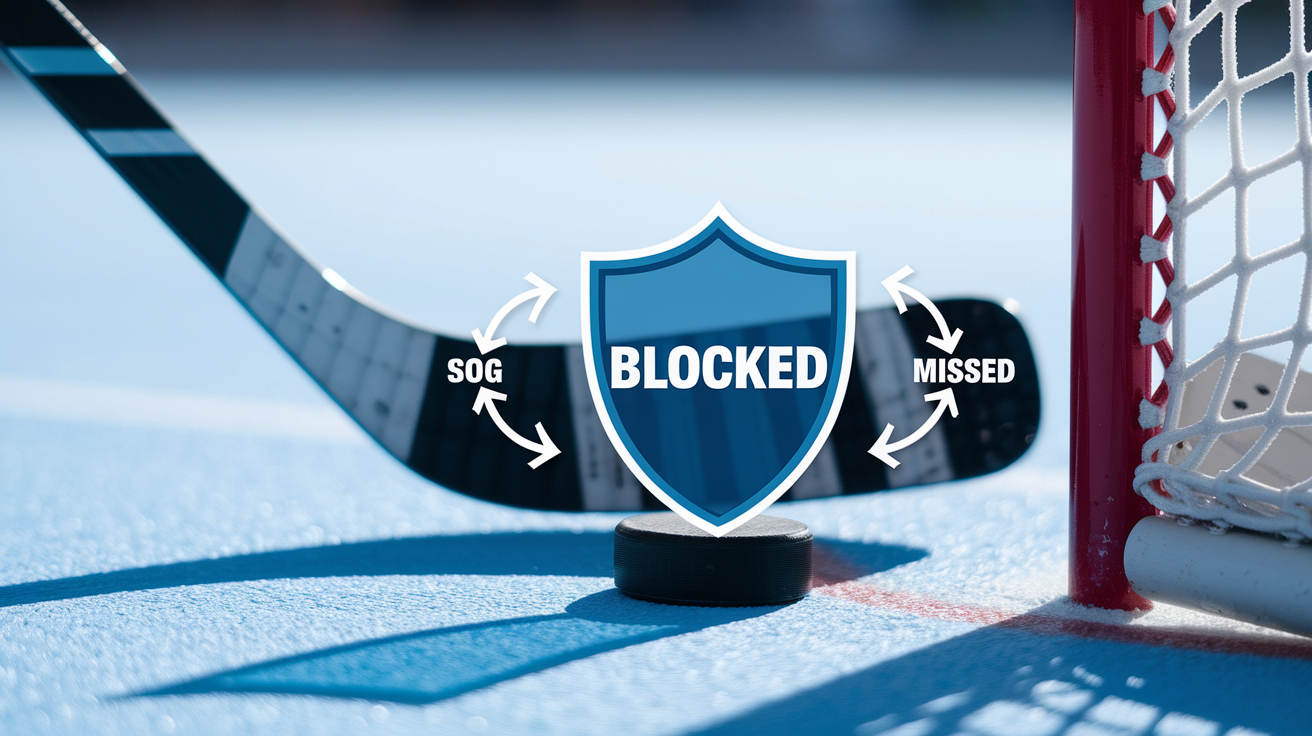
Corsi counts everything, including blocked shots. Fenwick drops blocks to focus on unblocked attempts that actually threatened the net.
Read on to learn how these metrics expose puck possession, when each gives a clearer picture, and how to use them to spot players and systems that truly drive play.
Core Concepts Behind Corsi and Fenwick Metrics

Corsi counts every shot attempt a team takes while a player’s on the ice: shots on goal, missed shots, and blocked shots. The formula’s simple. Corsi For (CF) equals all three types of attempts your team generates, and Corsi Against (CA) equals all attempts the opponent generates. The percentage is calculated as CF / (CF + CA) × 100. If a player’s on the ice when his team fires 55 shot attempts and the opponent fires 45, his Corsi For percentage (CF%) is 55.0%. Corsi acts as a proxy for puck possession because teams that control the puck tend to generate more shot attempts and allow fewer attempts against.
Fenwick uses the same logic but excludes blocked shots from the count. Fenwick For (FF) equals shots on goal plus missed shots, and Fenwick Against (FA) follows the same structure. If your team generates 35 unblocked attempts and the opponent generates 25, your Fenwick For percentage (FF%) is 58.33%. Fenwick removes the noise caused by shot blocking tactics and rink to rink scorer inconsistencies. Over longer samples, Fenwick often correlates more cleanly with future goal outcomes because blocked shots rarely become goals. Heavy shot blocking systems can distort Corsi totals without changing the underlying possession picture.
Modern hockey analytics rely on these metrics because goals and assists alone miss the story. Before analytics proved it, everyone thought third period comebacks were mostly grit. The numbers showed teams trailing late consistently outshoot opponents by wide margins, and shot volume predicts more than clutch play. Corsi and Fenwick reveal which teams and players drive territorial control, generate offensive pressure, and suppress opponent chances, regardless of whether pucks found the net on a given night.
Shot attempt classifications used in Corsi and Fenwick:
Shots on goal: any shot that reaches the goaltender or would have entered the net (counted in both Corsi and Fenwick)
Missed shots: attempts that miss the net entirely (counted in both Corsi and Fenwick)
Blocked shots: attempts blocked by a defender’s body, stick, or equipment (counted only in Corsi, excluded from Fenwick)
Unblocked attempts: shots on goal plus missed shots, which form the basis of Fenwick totals
For vs Against classification: “For” events occur when the tracked player’s team generates the attempt; “Against” events occur when the opponent generates the attempt while the player is on ice
Breaking Down How Corsi Measures Hockey Shot Attempts

Corsi tracks the total volume of shot attempts generated and allowed, treating every attempt as equal evidence of territorial advantage. When a team consistently generates more attempts than it allows, it spends more time in the offensive zone, forces the opponent into defensive scrambles, and creates more scoring opportunities over time. Raw Corsi counts (CF and CA) tell you the absolute numbers, but percentages normalize the picture so you can compare players who log different ice times or face different opponents.
Corsi For percentage (CF%) divides attempts generated by total attempts in both directions. If a line generates 40 shot attempts and allows 30 while on the ice, CF% is 57.14%. Corsi per 60 minutes converts raw totals into a rate stat: if a player’s on the ice for 50 Corsi For events across 120 minutes, his Corsi/60 is 25.0. Corsi Relative (CF% Rel) subtracts the team’s off ice CF% from the player’s on ice CF%. If the team’s CF% is 50% when you’re on the bench and 56% when you’re on the ice, your CF% Rel is +6 percentage points, meaning you’re lifting the team’s possession game.
| Shot Type | Included in Corsi? | Notes |
|---|---|---|
| Shots on goal | Yes | Any attempt that reaches the goaltender or enters the net |
| Missed shots | Yes | Attempts that miss the net entirely, recorded by official scorer |
| Blocked shots | Yes | Attempts blocked by a defending player before reaching the goalie |
| All shot attempts | Yes (sum of above) | Corsi = SOG + missed + blocked |
Understanding Fenwick as the Unblocked Shot Attempt Metric
Fenwick removes blocked shots from the equation because not all shot attempts carry the same information. A shot blocked at the blue line never threatened the goaltender. Teams that deploy aggressive shot blocking systems can artificially inflate opponent Corsi totals without actually losing territorial control. Fenwick focuses on attempts that had a realistic chance to become goals: shots on goal and missed shots. The formula mirrors Corsi. Fenwick For (FF) and Fenwick Against (FA) drive Fenwick For percentage (FF%), calculated as FF / (FF + FA) × 100. If a player’s line generates 35 unblocked attempts and allows 25, FF% lands at 58.33%, a cleaner signal of shot generation when blocking tactics vary widely.
Over longer samples, Fenwick often correlates more tightly with future goal outcomes because it filters out the noise of blocked attempts that never reach scoring danger. Analysts prefer Fenwick when evaluating teams with extreme shot blocking tendencies. Defensive systems that block 15 shots per game will show inflated opponent Corsi totals but more accurate Fenwick totals. Fenwick also smooths out scorer inconsistencies at the rink level, where one official might record a deflection as a block while another scores it as a miss. In practice, both metrics tell similar stories across large samples. But Fenwick shines when you need to isolate true shot generation ability from defensive tactics that suppress attempts without improving possession.
Calculating Corsi and Fenwick: Examples and Step by Step Visuals
The “For vs Against” structure splits all shot attempts into two buckets based on which team generated the event while a specific player was on the ice. Every shot attempt your team takes while you’re playing counts as a “For” event. Every shot attempt the opponent takes while you’re on the ice counts as an “Against” event. The ratio of For to total attempts (For plus Against) produces the percentage metrics that reveal possession impact.
Calculating Corsi Using Real Game Data
If Patrick Kane’s on the ice when the Blackhawks fire 10 shot attempts and the opponent fires 3, his raw Corsi totals are CF = 10 and CA = 3. His Corsi differential is +7, meaning Chicago outshot the opponent by seven attempts during his shifts.
Step by step Corsi calculation:
Count all Blackhawks shot attempts while Kane is on ice (shots on goal + missed + blocked) = 10
Count all opponent shot attempts while Kane is on ice (shots on goal + missed + blocked) = 3
Corsi For (CF) = 10; Corsi Against (CA) = 3
Corsi differential = CF minus CA = +7; CF% = 10 / (10 + 3) × 100 = 76.92%
Calculating Fenwick and Seeing the Difference
Using the same shift, imagine 2 of Chicago’s 10 attempts were blocked by the opponent and 1 of the opponent’s 3 attempts was blocked by a Blackhawks defender. Fenwick excludes those blocks. Kane’s Fenwick For becomes 8 (10 total minus 2 blocked), and Fenwick Against becomes 2 (3 total minus 1 blocked). His Fenwick differential is +6, slightly lower than Corsi because the blocked shots are removed. FF% = 8 / (8 + 2) × 100 = 80.0%.
| Date | CF% | FF% |
|---|---|---|
| 11/10/13 vs Oilers | 75.0% | 68.8% |
| 10/17/13 vs Blues | 69.2% | 77.8% |
| 11/6/13 vs Jets | 68.4% | 71.4% |
| 11/2/13 vs Jets | 39.1% | 50.0% |
Comparing Corsi and Fenwick: What Each Tells You About Hockey Possession
Corsi includes blocked shots, which makes it more sensitive to short term shot attempt volume and defensive shot suppression tactics. Fenwick excludes blocked shots, which removes the noise from heavy shot blocking systems and scorer inconsistencies but loses information about how effectively a team denies shooting lanes. If an opponent fires 20 attempts but your team blocks 8 of them, Corsi registers all 20 as “Against” events while Fenwick only counts the 12 unblocked attempts. Both metrics measure shot attempt share, but the blocked shot difference changes which situations favor each metric.
Over long samples (full seasons or 500 plus minutes), Corsi and Fenwick typically converge and tell nearly identical possession stories. Fenwick may perform slightly better as a predictor of future goal differential because blocked shots rarely become goals, and teams with extreme blocking rates can skew short term Corsi without changing underlying control. Corsi reacts faster in small samples and captures real time shot suppression, making it useful for tracking single game dominance or evaluating defensive zone systems that emphasize blocking. Neither metric measures shot quality directly, so a team with high CF% or FF% but poor shooting locations will still struggle to score.
Key comparison points between Corsi and Fenwick:
Corsi captures total shot attempt volume, including all blocking activity; Fenwick isolates unblocked attempts that had a realistic chance to reach the goalie
Fenwick reduces rink to rink scorer bias because blocked shot recording varies more than shots on goal and missed shot recording
Corsi stabilizes faster in small samples (single game or short series), making it better for immediate evaluation
Fenwick correlates slightly more tightly with future goals over large samples, making it preferable for long term projection models
Teams with aggressive shot blocking systems may show artificially high opponent Corsi totals but accurate Fenwick totals
Both metrics treat all shot attempts equally and miss differences in shot danger, distance, and traffic
Thresholds, Benchmarks, and How to Interpret Corsi/Fenwick
A CF% or FF% of 50.0% is the neutral baseline. Your team generates exactly as many attempts as it allows while you’re on the ice. Anything above 50% means you’re driving positive possession; anything below means the opponent controls more of the shot attempts. A CF% between 52% and 55% signals strong possession impact, and anything above 55% over a large sample typically indicates elite shot generation ability. These thresholds apply to both team level and player level percentages, though individual results swing more wildly across small samples.
Sample size dictates reliability. Most analysts require at least 300 to 400 minutes of five on five ice time before treating a player’s CF% or FF% as stable and meaningful. Under 200 minutes, random variation dominates. One bad game or one dominant shift can swing the percentage by several points. Team level metrics stabilize faster because the total ice time accumulates quickly, but even teams need 15 to 20 games before possession percentages settle into predictable ranges. Single game CF% totals are interesting but not predictive; treat them as snapshots, not forecasts.
Score effects create systematic bias in possession metrics. Teams protecting a lead typically sit back, defend more, and allow more shot attempts, lowering their CF% and FF% in the process. Teams trailing by two goals press for offense, generate more attempts, and inflate their CF% without actually controlling the game. Analysts adjust for this by isolating “close” situations (games within one goal during five on five play) where both teams deploy neutral tactics and possession metrics reflect true ability rather than situational strategy.
Five interpretation rules for Corsi and Fenwick percentages:
50.0% is the neutral baseline; above 50% is positive possession, below 50% is negative possession
55%+ over 400+ minutes typically indicates elite possession driving ability at the player or team level
Require 300 to 400 minutes minimum before drawing firm conclusions about individual player impact
Score effects bias percentages upward when trailing and downward when leading; use score adjusted or “close” metrics for cleaner evaluation
Stability improves with larger samples; single game percentages are noisy, full season percentages are reliable
Contextual Adjustments That Improve Corsi and Fenwick Accuracy
Zone starts skew possession metrics because players who start more shifts in the offensive zone inherit immediate shot attempt advantages. If a forward takes 60% of his faceoffs in the offensive zone, he’ll naturally log higher CF% and FF% than a defensive zone specialist, even if both players possess identical skill. Analysts track offensive zone start percentage and adjust interpretation accordingly. A winger with 58% CF% and 65% offensive zone starts is less impressive than a center with 54% CF% and 40% offensive zone starts. Raw percentages still matter, but context separates deployment advantage from true possession impact.
Relative metrics isolate individual contributions by comparing a player’s on ice CF% to the team’s CF% when that player sits on the bench. If your CF% is 56% and your team’s off ice CF% is 50%, your CF% Rel is +6 percentage points, showing you lift the team’s possession game. Quality of competition adjustments attempt to account for the strength of opponents faced, though measuring competition consistently remains difficult. Most public models use weighted averages of opponent CF% or TOI against top players, but these adjustments introduce their own noise and are best used as secondary context rather than primary evaluation tools.
Score Adjusted and Game State Variations
Game state changes shot attempt behavior more than any other variable. When leading by two goals, teams defend more conservatively, allow more zone entries, and give up more perimeter shot attempts while focusing on protecting the middle. When trailing by two, teams abandon defensive structure, pinch aggressively, and generate shot attempts at the expense of defensive integrity. Corsi Close isolates shifts when the score is within one goal during five on five play, filtering out situations where strategy overrides ability. A player with 53% CF% overall but 56% CF% Close is likely a stronger possession driver than the raw number suggests, because his trailing game minutes dragged down the overall average.
Practical Uses of Corsi and Fenwick in Real Hockey Decisions

At the team level, CF% and FF% predict goal differential more reliably than win loss record over the course of a season. A team with 54% CF% through 20 games but a losing record is likely underperforming its true talent and due for positive regression. A team with 48% CF% and a winning record is probably riding unsustainable goaltending or shooting luck and will regress downward. Front offices use possession metrics to identify when to buy or sell at the trade deadline, which coaches are extracting real performance versus riding variance, and whether early season success reflects skill or randomness.
Player evaluation leans heavily on CF% Relative, especially when comparing forwards with different linemates and deployment. A third line center who posts 52% CF% while starting 55% of his shifts in the defensive zone and facing tough matchups is more valuable than a second line winger with 54% CF% who starts 60% offensive zone and skates with elite linemates. Analysts layer possession metrics with ice time, zone starts, and quality of competition proxies to separate true possession drivers from passengers. Relative metrics highlight the handful of players who genuinely lift their team’s shot attempt share regardless of context.
Coaching staffs use Corsi and Fenwick to dial in line combinations and diagnose struggling units. If a defensive pair allows 58% opponent shot attempts over a 10 game stretch, coaches check whether the issue is system execution, matchup assignments, or personnel fit. Regression indicators like PDO (on ice shooting percentage plus on ice save percentage, baseline 100) help separate sustainable performance from luck. A line with 102 PDO and 48% CF% is likely headed for trouble; a line with 98 PDO and 54% CF% should see results improve as percentages normalize.
Five specific practical applications of Corsi and Fenwick:
Roster construction and free agent valuation: identify undervalued players with strong CF% Rel who haven’t yet posted strong point totals
Matchup planning: deploy high CF% lines against opponent shutdown pairs to tilt possession and create offensive zone time
Sustainability forecasting: use CF% combined with PDO to predict which hot starts will cool off and which slow starts will reverse
Prospect scouting: track junior and AHL possession metrics to project NHL readiness, especially for players without elite point production
Opponent preparation: study opponent CF% by line and zone entry tendencies to design defensive schemes that force dump ins and limit controlled entries
Quickly Checking Corsi and Fenwick in Public Hockey Databases

Most major public hockey analytics sites track CF%, FF%, and related metrics for every NHL player and team, with filters for five on five play, score close situations, and minimum time on ice thresholds. These databases pull from official league play by play feeds and calculate possession percentages, per 60 rates, and relative metrics automatically. You can compare players side by side, isolate specific date ranges, and export data for deeper analysis. The metrics update nightly during the season, so you’re working with current information rather than outdated snapshots.
Rink bias and scorer inconsistencies mean numbers vary slightly across different public sources. One arena’s official scorer might classify a deflection as a blocked shot while another scores it as a missed shot, shifting Corsi and Fenwick totals by one or two attempts per game. Over large samples these differences wash out, but single game totals can differ between sites. Most analysts cross reference two or three sources and focus on trends rather than exact counts when sample sizes are small.
Four main types of hockey analytics data sources:
Official league play by play feeds published by the NHL, which serve as the primary source for all public metrics
Public analytics aggregators and dashboards that calculate advanced stats and offer filtering, charting, and comparison tools
Team internal reporting systems that add proprietary tracking (zone entries, pass completions, defensive zone coverages) unavailable to the public
Fan built trackers and manual data collection projects that fill gaps in official stats, especially for junior and international leagues
Final Words
When the puck’s on the forecheck and shots pile up, Corsi and Fenwick are the quick tools that show who controlled the ice. We defined both metrics, ran through calculations and examples, compared strengths, and covered benchmarks, adjustments, and real-world uses.
Use this primer for understanding Corsi and Fenwick hockey analytics explained, and it helps you read possession, spot sustainable play, and choose what to train next.
Keep digging into the numbers. They’ll make your shifts and decisions clearer.
FAQ
Q: Is Corsi or Fenwick better?
A: Corsi or Fenwick being better depends on context; Fenwick removes blocked shots (cleaner over long samples), while Corsi counts all attempts (more volume, sharper short-term). Use both plus adjustments.
Q: What is a good Corsi score in hockey and how do you interpret Corsi?
A: A good Corsi score is CF% around 52–55% (strong) and above 55% (elite). Interpret Corsi as shot-attempt share (For/(For+Against)) and control for sample size, score, and usage.
Q: Why can’t you wear 69 in hockey?
A: You can’t wear 69 in hockey because the number has an obvious sexual connotation; teams and leagues often ban it to avoid distractions, locker-room jokes, and professionalism issues.